
As we get to the end of July, and I face another day of listening to myself complaining about the heat I thought I’d see how it actually compared to ’76, when I was at the start of primary school. I remember the school playground being too hot to touch, so even if we wanted to venture out to the lovely safety-first 70’s steel climbing frame that dropped us straight onto concrete we couldn’t really.
Anyway, I could only actually be bothered to do this by getting Claude to help.
I grew up in Wherwell in Hampshire, and now live in Caerleon in South Wales. Claude pointed me to Meteo as a data source, and then also used the Chrome browser plugin to access date from the Met office as a check.
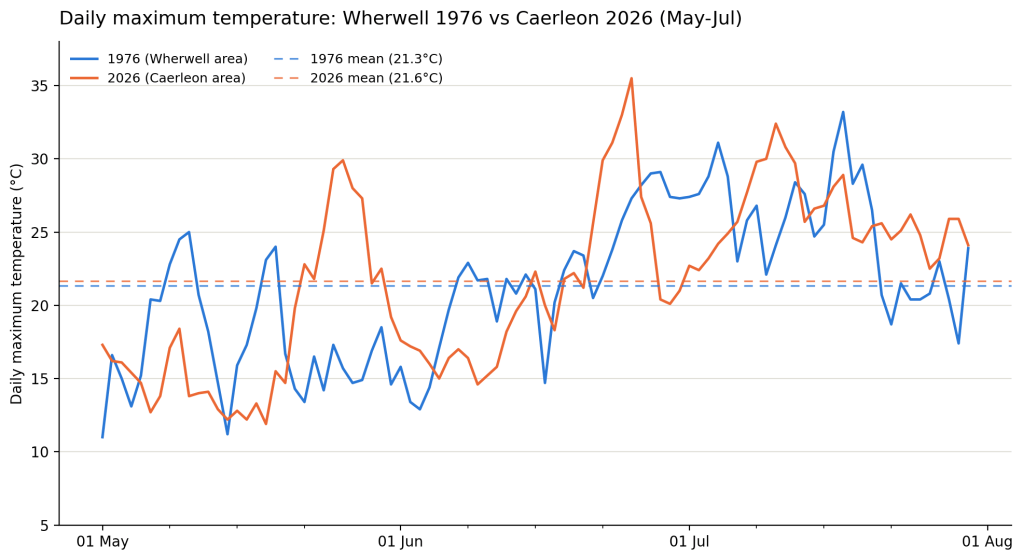
First the maximum temperatures – and I’m going to call it ‘broadly comparable’
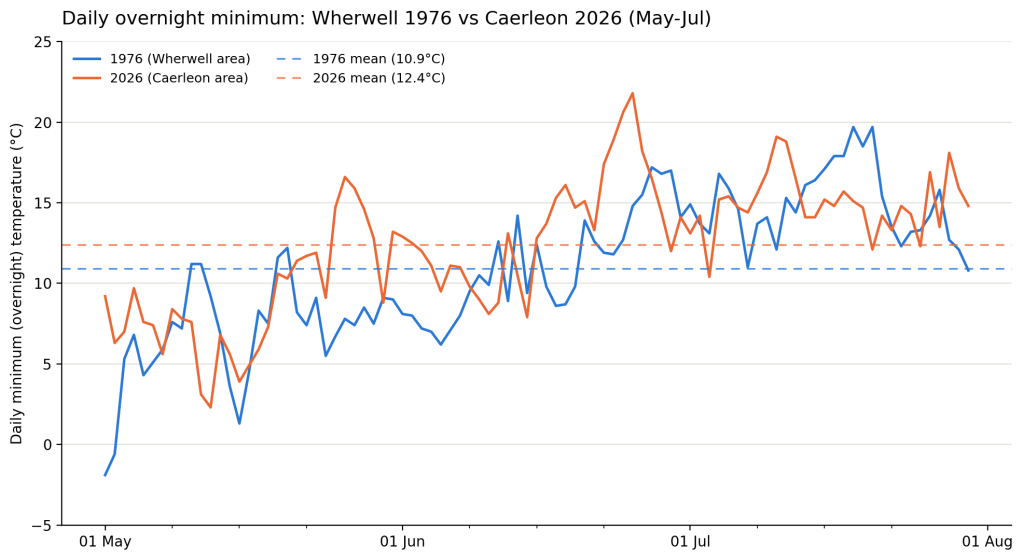
And now the night time temperature which perhaps helps explain why I’m so grumpy – it’s meaningfully hotter now.
I also wondered how many days it was hotter in both years. Again, I’m going to say ‘broady comparable’
2026 (Caerleon) was meaningfully hotter on 36 days, mostly clustered in late May and mid-to-late July. 1976 (Hampshire) was meaningfully hotter on 33 days, concentrated in the second half of June and the first week of July, which is exactly its famous sustained plateau. The remaining 21 days were within 2°C of each other.
What’s the point of this? In all honesty, nothing! I was just curious.


Leave a Reply